Practice Essentials
Spinal stenosis is a progressive narrowing of the spinal canal that occurs most commonly in the cervical and lumbar areas. Lumbar spinal stenosis affects over 100 million persons worldwide, and approximately 600,000 surgical procedures are performed in the United States each year for the condition. The prevalence of lumbar spinal stenosis in US adults is about 11% and increases with age, with people in their 60s and 70s most commonly affected. [1, 2, 3, 4]
Consensus criteria are needed to define and classify spinal stenosis. The means by which spinal stenosis is diagnosed is also changing. Concerns related to radiation risk of CT scans and the recognized limitations of spinal radiography suggest that MRI represents the best imaging modality. In many cases, clinical correlation between the findings on MRI and the symptomatic presentation of patients has been confirmed. [5] MRI helps avoid myelography and is often better accepted by patients who wish to avoid the associated (small) risk and pain associated with myelography. In selected patients, following placement of metallic fixation devices, myelography together with advanced CT techniques remains necessary. In one study, electrodiagnostic studies showed no superior accuracy as compared to MRI. Electrodiagnostic studies, when needed, should be limited to specific conditions such as radiating leg pain.
Radiography
Standard radiographs remain the recommended initial imaging study of choice in spinal stenosis. [1] In patients with severe stenosis, cervical spine radiographs are useful; however, radiographic studies are insensitive to soft-tissue hypertrophy and other non-osseous causes of spinal stenosis. In the older patient, standard radiographs help exclude more serious conditions, such as pathologic compression fracture. Anterior osteophytes, even when they become very large, may not be related to spinal symptoms; however, large anterior osteophytes may be a cause of dysphagia due to compression on the cervical esophagus.
On the lateral view, spondylosis appears as curvilinear bony outgrowths from the lateral and posterior margins of the vertebral body endplates. The general outline of each vertebral body should be reviewed to exclude possible chronic compression injuries or pathologic compression fractures.
Hypertrophic facet joints are best seen on oblique views in which narrowing of the neuroforaminal spaces in the cervical spine and lumbar spine regions are commonly visualized. In the cervical spine, uncovertebral hypertrophy is best visualized on oblique and lateral views. The AP view is useful for the assessment of alignment and uniformity of the interspinous process distances. The soft tissues surrounding the lumbar spine can be evaluated on the standard AP radiograph. Disruption of the psoas muscle stripe may indicate a paravertebral abscess or tumor. [39]
Although few false-positive findings exist, occasionally, even marked anterior spondylosis is not associated with significant central spinal canal narrowing. Diseases associated with bone softening may be related to significant spinal canal narrowing without obvious radiographic findings.
(Radiographic images of spinal stenosis are provided below.)
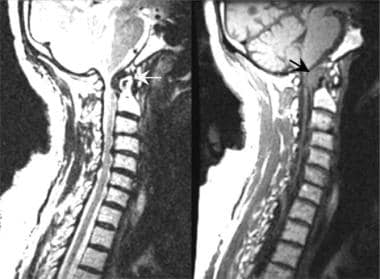
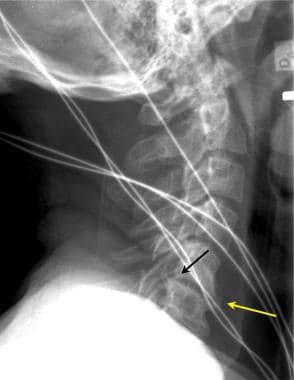 Lateral cervical spine radiographs may demonstrate significant degenerative changes with both interspace narrowing (yellow arrow) and osteophytic spinal canal narrowing (black arrow) in otherwise asymptomatic patients. This lateral radiographic film was taken for the evaluation of trauma. The patient had no chronic neurologic complaints.
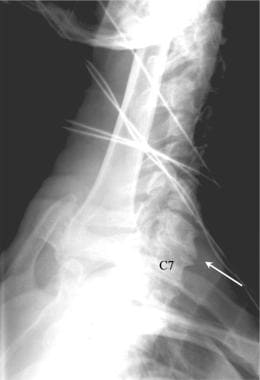 To better evaluate the lower cervical spine, a lateral view of the cervical spine with the patient's right arm above the head (swimmer's view) may be helpful. In this case of trauma, the lower cervical spine (vertebral level C6/C7) was seen in the lateral projection only on the swimmer's view (white arrow). Note the cervical spondylosis, which was an incidental finding.
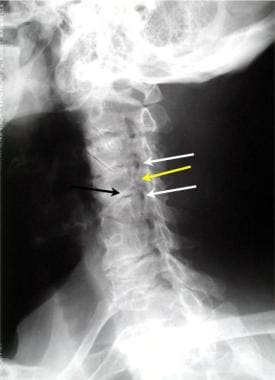 Oblique view of the cervical spine demonstrates 2 levels of foraminal stenosis (white arrows) resulting from facet hypertrophy (yellow arrow) and uncovertebral joint hypertrophy.
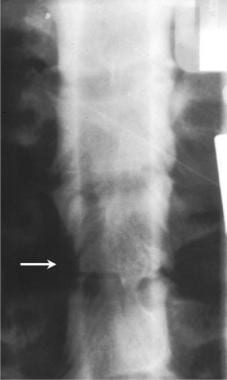 Anteroposterior cervical myelogram demonstrates compression of a right-sided nerve root. Unfortunately, compression of a nerve root sleeve is a nonspecific finding that can be the result of a disc herniation or cervical spondylosis.
 Anterior view of a lumbar myelogram demonstrates stenosis related to Paget disease. Myelography is limited because of the superimposition of multiple spinal structures that contribute to the overall pattern of stenosis.
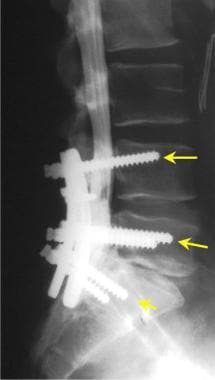 Lateral view of a lumbar myelogram performed in a patient who has been fused across the L4-L5 and the L5-S1 vertebral interspaces using transpedicular screws. Treatment of lumbar spinal stenosis may include decompression laminectomies, followed by the placement of transpedicular screws (yellow arrows) with a posterior stabilization bar.
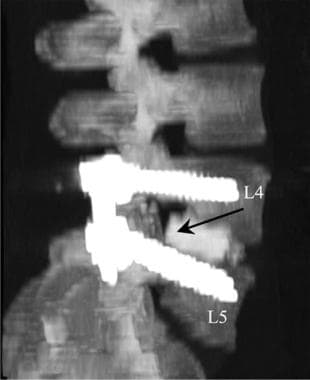 Sagittal view of a 3-dimensional volume computed tomography image of the lumbar spine in a patient with a posterior fusion using transpedicular screws in L4 and L5. Note that an interposition graft has been placed between L4 and L5 to maintain satisfactory intervertebral distance.
Computed Tomography
On CT scans, spinal stenosis is well defined as the diminished diameter(s) and cross-sectional area of the spinal canal. CT scanning of the cervical spine can be improved using intravenous contrast agents to enhance the epidural veins, thus better defining the margins of the epidural space. While MRI has largely replaced contrast-enhanced CT in the diagnosis of disc herniations, contrast-enhanced CT remains helpful in patients who cannot undergo an MRI because of the presence of a pacemaker or aneurysm clip. Postoperative complications and epidural hematoma or abscess can be imaged using contrasted CT spinal imaging in such patients. Enhancement of epidural fibrosis is greatest soon after surgery. Paraspinal masses may present with associated calcifications or may appear as cystic or fluid collections in the case of an abscess. In all cases, the relationship of the mass to the central spinal canal, the lateral spinal canal recess, and the neuroforamen should be determined. All images should be reviewed with both a standard soft-tissue window and a narrow window to evaluate bone disease and calcifications. [1, 19]
(CT images of spinal stenosis are provided below.)
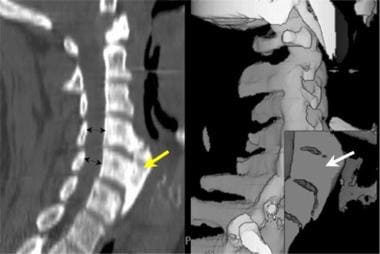 This midline sagittal multireformatted computed tomography scan of the cervical spine (left image) demonstrates a very large anterior osteophyte (yellow arrow) that is causing dysphasia. The spinal canal is normal in diameter (black double arrows). The shaded surface volume image of the same patient (right image) demonstrates the uniformly dense nature of the hypertrophic bone in this patient (white arrow).
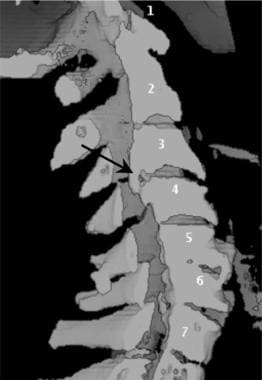 Sagittal volume reconstruction of a computed tomography scan of cervical spinal stenosis. The reconstructed image has been cut along the midline sagittal plane to demonstrate the spinal canal. Note the large central osteophyte (black arrow) at the C3/C4 vertebral level, which narrows the anteroposterior diameter of the cervical spine.
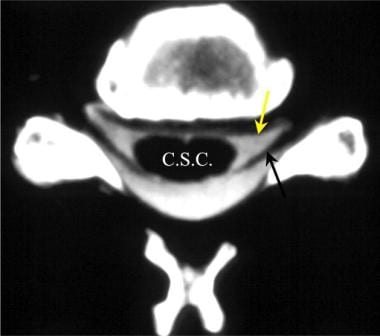 Axial computed tomography myelogram. Note the excellent visualization of the cervical spinal cord (C.S.C), as well as the ventral and dorsal nerve roots.
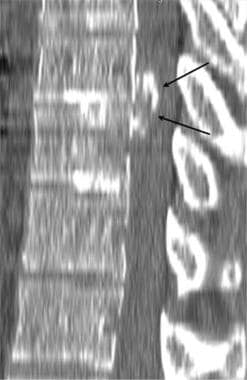
 Axial cervical computed tomography myelogram demonstrates marked hypertrophy of the right facet joints (black arrows), which results in tight restriction of the neuroforaminal recess and lateral neuroforamen.
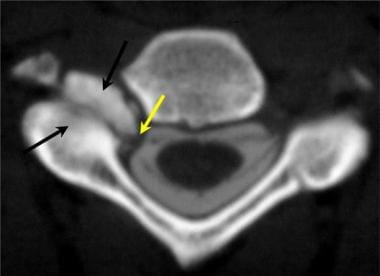
 This axial computed tomography (CT) image from a CT myelogram of the cervical spine demonstrates left-sided spondylosis (black arrow) resulting in lateral recess stenosis (double yellow arrow) and lateral neuroforaminal stenosis (white arrow). In this case, the hypertrophy is primarily an osteophytic overgrowth of the uncovertebral joint on the left. This is an example of lateral cervical spinal stenosis resulting in primarily upper extremity nerve root symptoms.
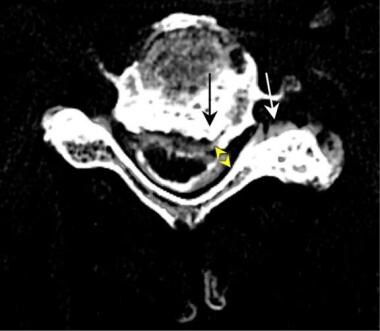
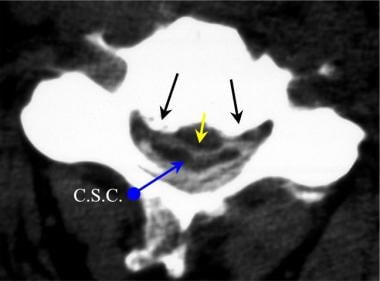 Axial computed tomography (CT) image from a CT myelogram demonstrates central cervical canal stenosis. Note the spondylosis with hypertrophic bone spurs (black arrows) and the central disc protrusion (yellow arrow), which result in severe cervical spinal cord compression (C.S.C.) (blue arrow).
 Sagittal 3-dimensional reconstruction computed tomography scan of the thoracic spine in chronic thoracic disc herniation.
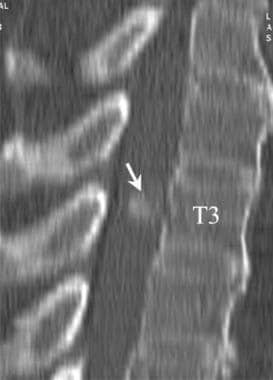 Sagittal reformatted computed tomography scan demonstrates central canal mass (arrow), which was determined to be a meningioma.
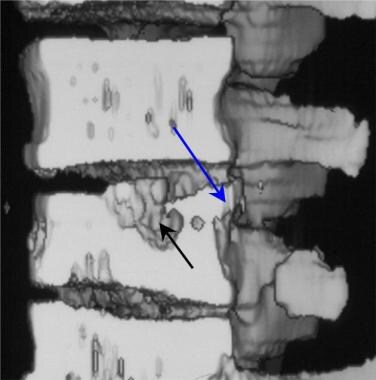 Sagittal midline-cut view of a 3-dimensional reconstruction of computed tomography images in tuberculosis spondylitis. Note the cavity within the central portion of the thoracic vertebral body (black arrow). The posterior margin of the vertebral endplate has begun to displace into the spinal canal (blue arrow), resulting in spinal canal stenosis.
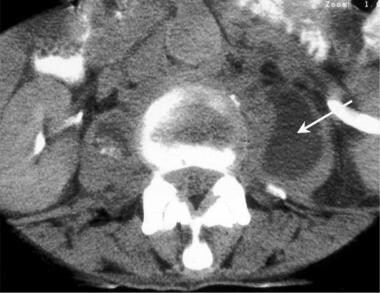 Axial computed tomography image from a patient who presented with left-sided paraspinal back pain. A left psoas muscle abscess is indicated by the white arrow. Tuberculosis bacteria were cultured from a needle aspiration.
 Magnetic resonance image of a thoracic spinal hemangioma associated with a pathologic fracture in a young pregnant woman.
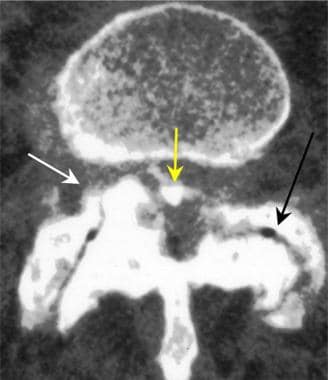 Axial 3-dimensional image from computed tomography myelography in a patient with severe spinal stenosis. The stenotic pattern (yellow arrow) results from hypertrophic facet joints (black arrow), bulging of disc annulus (white arrow), and thickened ligamentum flavum posteriorly.
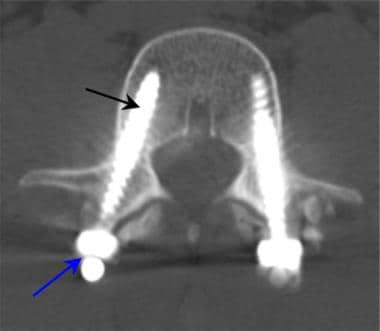 Axial computed tomography image through the pedicles of L4 demonstrates the desired position of transpedicular screws (black arrow). The screws are connected posteriorly by a bar (blue arrow) to provide posterior spinal fixation.
Degree of confidence
Osseous and calcified features are well outlined on CT scans. Findings in epidural soft-tissue diseases rely on the displacement of epidural fat or contrast enhancement, which may vary. In general, the use of intravenous contrast agents improves the visualization of soft-tissue diseases, masses, and abscesses.
False-positive findings related to epidural scarring result from a failure of fibrotic tissue to enhance years after surgery. False-negative CT examinations occur because of far lateral lesions, which become averaged together with the surrounding bone of the neuroforaminal space. The evaluation for an abscess is difficult immediately following surgery. The residual blood and gas in the tissues may appear similar to an infectious process. Delayed follow-up examinations are recommended.
Magnetic Resonance Imaging
Spinal stenosis is best diagnosed using MRI. In the lumbar spine, MRI sequences may include sagittal T1-weighted, T2-weighted, STIR, and proton density-weighted, as well as axial T1-weighted and T2-weighted sequences. [1] Measurements taken from sagittal images are particularly useful and, in most patients, can be accepted as accurate. Although measurements of the cervical canal are important, interpretation of the diagnosis of spinal canal stenosis must be made carefully. The clinical significance of spinal canal stenosis in children is probably less important than the increased mobility of the child's neck as compared to that of the adult. Due to susceptibility artifacts related to osseous and calcified structures, gradient-echo images tend to result in slight overestimations of the degree of stenosis in the lateral recesses and neuroforaminal spaces.
On MRI, findings of spinal stenosis have a variable presentation depending on the specific disease causing the stenosis, as well as associated edema of the related vertebral bodies. [16, 17, 18, 40, 41] Some of these findings are as follows:
-
Osteophytes and calcified bulging disc structures are dark on T2-weighted fast spin-echo and T1-weighted spin-echo imaging.
-
Osteophytic tissues are dark on T2-weighted gradient-echo images.
-
Epidural soft tissues and related disease processes are typically isointense on T1-weighted noncontrast images, compared to muscle, synovial tissues, and most spinal ligaments.
-
Vertebral endplates present a variable degree of increased or even decreased brightness on T2-weighted images, depending on the degree of inflammation and the chronic nature of the degenerative changes.
-
Following intravenous administration of gadolinium diethylenetriaminepentaacetic acid (DTPA), fibrosis or surgical inflammatory changes, extra-axial tumors, and some stress reactions within vertebral body endplates present an increased signal brightness on T1-weighted images.
-
Postcontrast T1-weighted images are most useful in the detection of neoplasms and spinal infections if a fat-suppression technique is used.
The assessment of cervical spine stenosis is improved by careful evaluation of CSF flow in the region of the stenosis. Spatial modulation of magnetization allows the degree of stenosis to be correlated with restriction to the CSF flow. In high-grade stenosis, both the diastolic and the systolic CSF flow velocities are reduced. The degree of symptoms has been correlated to the compromised cervical cord and the related effects upon CSF flow.
(Magnetic resonance images of spinal stenosis are provided below.)
 Short recovery time T1-weighted spin-echo sagittal magnetic resonance image (MRI) demonstrates marked spinal stenosis of the C1/C2 vertebral level cervical canal resulting from formation of the pannus (black arrow) surrounding the dens in a patient with rheumatoid arthritis. Long recovery time T2*-weighted fast spin-echo sagittal MRI scans better define the effect of the pannus (white arrow) on the anterior cerebrospinal fluid space. Note the anterior displacement of the upper cervical cord and the lower brainstem.
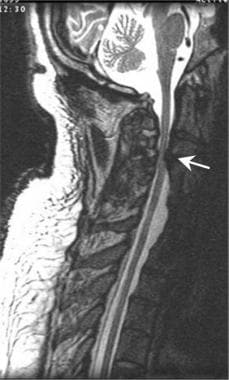 This sagittal T2-weighted cervical spine magnetic resonance image demonstrates a high-grade spinal stenosis of the vertebral level C3/C4 interspace resulting from spondylosis (arrow). Sagittal T2-weighted images provide excellent visualization of the cerebrospinal fluid, which has a bright signal, compared with the narrowed canal and compressed cervical cord.
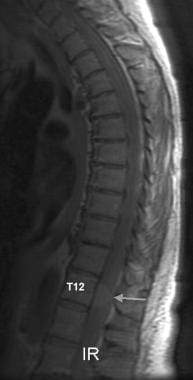 Sagittal magnetic resonance image of a meningioma of the lower thoracic spine obtained without contrast enhancement. The anterior spinal canal is occupied by a mass that displaces and compresses the conus medullaris at the T12 level. The mass (white arrow) is of intermediate increased signal brightness, compared with the normal spinal cord.
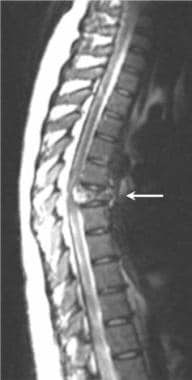
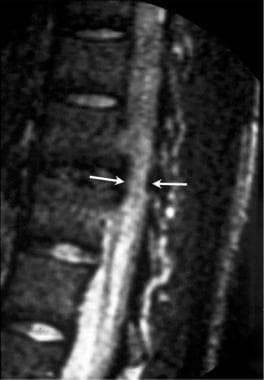 Long recovery time T2*-weighted fat-suppressed sagittal magnetic resonance image of the thoracic spine demonstrates central canal spinal stenosis (white arrows). Note the decreased signal from the abnormal interspace in this patient with tuberculosis spondylitis.
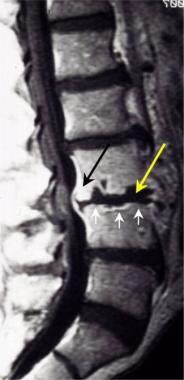 Sagittal T1-weighted magnetic resonance image of the spine in discitis. Note the posterior bulging of the vertebral body endplate and disc annulus into the spinal canal (black arrow). The endplates of the disc interspace enhance following an injection of gadolinium diethylenetriamine pentaacetic acid (white arrows), whereas the central abscess within the disc space remains dark (yellow arrow).
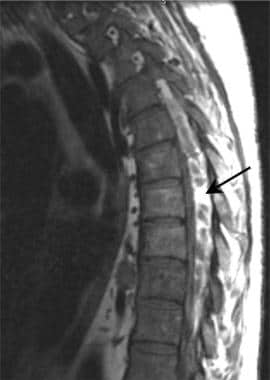 Sagittal noncontrast T1-weighted magnetic resonance image of the thoracic spine in a renal transplant recipient. Note the extra-axial posterior mass within the thoracic spinal canal (arrow). The thoracic spinal cord is displaced forward by an extramedullary lipid-rich (fat) mass.
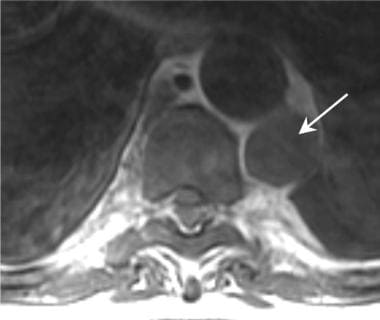 Axial T1-weighted magnetic resonance image of the lower thoracic spine and chest. Biopsy was performed on a large left paraspinal mass. The mass in the spinal canal and in the paraspinal area is extramedullary hematopoietic tissue.
Gadolinium
Gadolinium-based contrast agents have been linked to the development of nephrogenic systemic fibrosis (NSF) or nephrogenic fibrosing dermopathy (NFD). The disease has occurred in patients with moderate to end-stage renal disease after being given a gadolinium-based contrast agent to enhance MRI or MRA scans. NSF/NFD is a debilitating and sometimes fatal disease. Characteristics include red or dark patches on the skin; burning, itching, swelling, hardening, and tightening of the skin; yellow spots on the whites of the eyes; joint stiffness with trouble moving or straightening the arms, hands, legs, or feet; pain deep in the hip bones or ribs; and muscle weakness.
False positives/negatives
On MRI, false-positive findings of central spinal stenosis rarely occur. Gradient-echo images may lead to overestimation of the degree of a lateral recess and neuroforaminal space stenosis. Comparison with T2-weighted axial and sagittal images are recommended in all cases. CSF-pulsation artifacts seen on sagittal T2-weighted fast spin-echo images may give rise to a false impression of dorsal stenosis. False-negative MRI results are generally related to movement artifacts and the presence of metal in the region of interest.
Nuclear Imaging
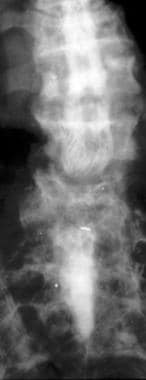
Spinal stenosis may be generally reflected on single-photon emission computed tomography (SPECT) nuclear medicine images as areas of increased activity related to the vertebral body endplates, facet joints, and uncovertebral joints. Medical diseases related to the bones of the vertebral bodies, such as Paget disease, present with markedly increased nuclide uptake (see the image below). Metastatic disease, which may cause spinal canal stenosis, is usually associated with increased uptake of the nuclide agent in the areas of abnormal bone. The abnormalities seen in nuclear imaging studies should be correlated with comparison to radiographic, CT, or MRI studies.
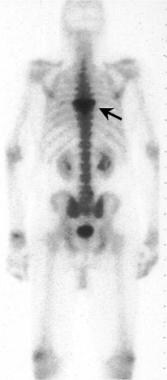 Posterior view from a radionuclide bone scan. A focally increased uptake of nuclide (black arrow) is demonstrated within the mid to upper thoracic spine in a patient with Paget disease.
Degree of confidence
Most causes of spinal stenosis have nonspecific findings on nuclear medicine studies. Paget disease, osteomyelitis, and spinal metastasis have strongly positive focal findings.
Many cases of spinal stenosis are not identified using SPECT nuclear medicine as a primary diagnostic method. Nuclear medicine scans may demonstrate positive findings in the absence of spinal stenosis. SPECT spinal imaging should be reserved for patients in whom osteomyelitis, Paget disease, or other specific disease conditions exist. Some diseases in which only bone destruction occurs may not have increased uptake in the areas of metastatic disease.
Angiography
Angiography is rarely indicated except in patients with arteriovenous malformations, dural fistulas, and vascular spinal tumors. In these patients, the degree of spinal canal narrowing can only be inferred on the basis of venous or arterial displacement or neovascularity.
Spinal angiography can indicate spinal canal narrowing only indirectly, based on epidural enhancement and vascular (venous) dilatation.
Spinal angiography should be reserved for specific indications related to arteriovascular malformations, arteriovascular fistulae, and highly vascular tumors. Epidural venography was performed before the availability of MRI. As a result of the variability of the epidural venous plexus, use of epidural vein displacement as an indication of a lateral disc herniation is subject to both false-positive and false-negative diagnoses.

-
Sagittal measurements taken of the anteroposterior diameter of the cervical spinal canal are highly variable in otherwise healthy persons. An adult male without spinal stenosis has a diameter of 16-17 mm in the upper and middle cervical levels. Magnetic resonance imaging (MRI) scans and reformatted computed tomography (CT) images are equally as effective in obtaining these measurements, whereas radiography is not accurate.
-
Lateral cervical spine radiographs may demonstrate significant degenerative changes with both interspace narrowing (yellow arrow) and osteophytic spinal canal narrowing (black arrow) in otherwise asymptomatic patients. This lateral radiographic film was taken for the evaluation of trauma. The patient had no chronic neurologic complaints.
-
To better evaluate the lower cervical spine, a lateral view of the cervical spine with the patient's right arm above the head (swimmer's view) may be helpful. In this case of trauma, the lower cervical spine (vertebral level C6/C7) was seen in the lateral projection only on the swimmer's view (white arrow). Note the cervical spondylosis, which was an incidental finding.
-
Oblique view of the cervical spine demonstrates 2 levels of foraminal stenosis (white arrows) resulting from facet hypertrophy (yellow arrow) and uncovertebral joint hypertrophy.
-
This midline sagittal multireformatted computed tomography scan of the cervical spine (left image) demonstrates a very large anterior osteophyte (yellow arrow) that is causing dysphasia. The spinal canal is normal in diameter (black double arrows). The shaded surface volume image of the same patient (right image) demonstrates the uniformly dense nature of the hypertrophic bone in this patient (white arrow).
-
Sagittal volume reconstruction of a computed tomography scan of cervical spinal stenosis. The reconstructed image has been cut along the midline sagittal plane to demonstrate the spinal canal. Note the large central osteophyte (black arrow) at the C3/C4 vertebral level, which narrows the anteroposterior diameter of the cervical spine.
-
Oblique 3-dimensional shaded surface display computed tomography reconstruction of right foraminal stenosis resulting from unilateral facet hypertrophy (black arrow). The volume of the reconstruction has been cut obliquely across the neuroforaminal canal.
-
Anteroposterior cervical myelogram demonstrates compression of a right-sided nerve root. Unfortunately, compression of a nerve root sleeve is a nonspecific finding that can be the result of a disc herniation or cervical spondylosis.
-
Lateral swimmer's radiographic view demonstrates compression of the anterior contrast-filled cervical thecal sac. The defect helps localize the stenosis; however, the pattern does not reflect lateral disc herniation or spondylosis directly.
-
Axial computed tomography myelogram. Note the excellent visualization of the cervical spinal cord (C.S.C), as well as the ventral and dorsal nerve roots.
-
Axial cervical computed tomography myelogram demonstrates marked hypertrophy of the right facet joints (black arrows), which results in tight restriction of the neuroforaminal recess and lateral neuroforamen.
-
This axial computed tomography (CT) image from a CT myelogram of the cervical spine demonstrates left-sided spondylosis (black arrow) resulting in lateral recess stenosis (double yellow arrow) and lateral neuroforaminal stenosis (white arrow). In this case, the hypertrophy is primarily an osteophytic overgrowth of the uncovertebral joint on the left. This is an example of lateral cervical spinal stenosis resulting in primarily upper extremity nerve root symptoms.
-
Axial computed tomography (CT) image from a CT myelogram demonstrates central cervical canal stenosis. Note the spondylosis with hypertrophic bone spurs (black arrows) and the central disc protrusion (yellow arrow), which result in severe cervical spinal cord compression (C.S.C.) (blue arrow).
-
Short recovery time T1-weighted spin-echo sagittal magnetic resonance image (MRI) demonstrates marked spinal stenosis of the C1/C2 vertebral level cervical canal resulting from formation of the pannus (black arrow) surrounding the dens in a patient with rheumatoid arthritis. Long recovery time T2*-weighted fast spin-echo sagittal MRI scans better define the effect of the pannus (white arrow) on the anterior cerebrospinal fluid space. Note the anterior displacement of the upper cervical cord and the lower brainstem.
-
Axial T2-weighted gradient echo magnetic resonance image scan. Note the high-grade spinal stenosis resulting in severe upper cervical cord compression (arrows). This patient presented with a central spinal cord syndrome that improved following surgical decompression.
-
This sagittal T2-weighted cervical spine magnetic resonance image demonstrates a high-grade spinal stenosis of the vertebral level C3/C4 interspace resulting from spondylosis (arrow). Sagittal T2-weighted images provide excellent visualization of the cerebrospinal fluid, which has a bright signal, compared with the narrowed canal and compressed cervical cord.
-
Sagittal T2-weighted magnetic resonance image demonstrates severe stenosis. Spinal stenosis is demonstrated at several levels (white and yellow arrows) resulting from a combination of disc annulus bulging (white arrow) and epidural soft-tissue thickening (yellow arrow).
-
Superior-to-inferior view of 3-dimensional volume reconstruction computed tomography scan of central canal spinal stenosis resulting from chronic disc herniation. The patient presented with lower extremity weakness and loss of bladder control.
-
Sagittal 3-dimensional reconstruction computed tomography scan of the thoracic spine in chronic thoracic disc herniation.
-
Sagittal reformatted computed tomography scan demonstrates central canal mass (arrow), which was determined to be a meningioma.
-
Sagittal magnetic resonance image of a meningioma of the lower thoracic spine obtained without contrast enhancement. The anterior spinal canal is occupied by a mass that displaces and compresses the conus medullaris at the T12 level. The mass (white arrow) is of intermediate increased signal brightness, compared with the normal spinal cord.
-
Sagittal T2 weighted fast spin-echo (FSE) magnetic resonance image of a meningioma of the lower thoracic spine obtained without contrast enhancement. The effect of the mass is better seen because of the contrast between the mass and the cerebrospinal fluid (CSF). The anterior spinal canal is occupied by a mass that displaces and compresses the conus medullaris (C) at the T12 level. The mass (white arrow) is of intermediate increased signal brightness, compared with the normal spinal cord.
-
Sagittal T1-weighted spin-echo (SE) magnetic resonance image of a meningioma of the lower thoracic spine obtained following IV gadolinium contrast enhancement. The mass is better seen because of the contrast enhancement within the meningioma (M). The anterior spinal canal is occupied by a mass that displaces and compresses (white arrows) the conus medullaris (C) at the T12 level. The mass (white arrow) is of intermediate increased signal brightness, compared with the normal spinal cord.
-
Normal findings in the thoracic spine as demonstrated by computed tomography myelography. Note the detail of the spinal cord and the ventral and dorsal nerves surrounded by contrast.
-
Long recovery time T2*-weighted fat-suppressed sagittal magnetic resonance image of the thoracic spine demonstrates central canal spinal stenosis (white arrows). Note the decreased signal from the abnormal interspace in this patient with tuberculosis spondylitis.
-
Sagittal midline-cut view of a 3-dimensional reconstruction of computed tomography images in tuberculosis spondylitis. Note the cavity within the central portion of the thoracic vertebral body (black arrow). The posterior margin of the vertebral endplate has begun to displace into the spinal canal (blue arrow), resulting in spinal canal stenosis.
-
Coronal-cut view of 3-dimensional reconstruction computed tomography scan of the thoracic spine in tuberculosis spondylitis. Note the central spinal cavity (black arrow). The vertebral endplate has compressed downward (double blue arrows). The advantage of 3-dimensional reconstructions is the ability to better preoperatively evaluate the type of surgery needed to stabilize spinal compression fractures.
-
Axial computed tomography image from a patient who presented with left-sided paraspinal back pain. A left psoas muscle abscess is indicated by the white arrow. Tuberculosis bacteria were cultured from a needle aspiration.
-
Paraspinal abscess aspiration biopsy. The stains were positive for mycobacteria (black arrows) (acid-fast stain, magnification ×100).
-
Sagittal T1-weighted magnetic resonance image of the spine in discitis. Note the posterior bulging of the vertebral body endplate and disc annulus into the spinal canal (black arrow). The endplates of the disc interspace enhance following an injection of gadolinium diethylenetriamine pentaacetic acid (white arrows), whereas the central abscess within the disc space remains dark (yellow arrow).
-
With the patient in a prone position and using computed tomography localization, a bone biopsy and aspiration were performed from the area of greatest destruction within the vertebral endplate (arrow).
-
Aspergillosis organisms were recovered from a lumbar disc space abscess. The patient had received a renal transplant 12 months before onset of the infection (hematoxylin and eosin, magnification ×40).
-
Long recovery time T2*-weighted fat-suppressed sagittal magnetic resonance image of the thoracic spine demonstrates subtle enlargement of a thoracic vertebral body (double white arrows) and a slightly increased degree of signal brightness within the vertebral body (yellow arrow).
-
Posterior view from a radionuclide bone scan. A focally increased uptake of nuclide (black arrow) is demonstrated within the mid to upper thoracic spine in a patient with Paget disease.
-
Paget disease of the thoracic spine. Thoracic spinal computed tomography scan demonstrates enlarged vertebral body endplates (black arrows). The axial image on the left demonstrates the characteristic thickening of the bony matrix of the vertebral body.
-
Magnetic resonance image of a thoracic spinal hemangioma associated with a pathologic fracture in a young pregnant woman.
-
Axial lumbar computed tomography scan demonstrates marked right-sided spinal canal stenosis (black arrow) resulting from advanced right-sided facet hypertrophy. Note the vacuum disc sign within the intervertebral disc (double yellow arrow). The vacuum disc sign is further indication of degenerative changes and spinal instability.
-
Lumbar computed tomography myelogram demonstrates a normal central canal diameter.
-
Anterior view of a lumbar myelogram demonstrates stenosis related to Paget disease. Myelography is limited because of the superimposition of multiple spinal structures that contribute to the overall pattern of stenosis.
-
Axial 3-dimensional image from computed tomography myelography in a patient with severe spinal stenosis. The stenotic pattern (yellow arrow) results from hypertrophic facet joints (black arrow), bulging of disc annulus (white arrow), and thickened ligamentum flavum posteriorly.
-
Pantopaque tracer in the epidural spaces. Pantopaque can remain in the epidural and facial spaces for years following a myelogram. Chronic inflammatory arachnoiditis has been associated with a combination of trauma (bleeding) with administration of Pantopaque.
-
Sagittal noncontrast T1-weighted magnetic resonance image of the thoracic spine in a renal transplant recipient. Note the extra-axial posterior mass within the thoracic spinal canal (arrow). The thoracic spinal cord is displaced forward by an extramedullary lipid-rich (fat) mass.
-
Axial T1-weighted magnetic resonance image of the lower thoracic spine and chest. Biopsy was performed on a large left paraspinal mass. The mass in the spinal canal and in the paraspinal area is extramedullary hematopoietic tissue.
-
Computed tomography localization of thoracic lesion before surgical correction. A needle/wire localization technique is used to ensure the correct surgical level. Such preoperative localizations save time in the operating suite while reducing the need for intraoperative radiology.
-
Sagittal 3-dimensional computed tomography reconstruction of the lumbar spine in a patient with multiple myeloma. The central portions of the vertebral bodies (yellow arrows) have been replaced by the nonossified tumor.
-
Biopsy (yellow arrow) of a multiple myeloma mass (black arrow) that has replaced the lumbar spinal canal (blue arrow) completely.
-
Multiple myeloma. Photomicrograph of an aspiration biopsy specimen.
-
Lateral view of a lumbar myelogram performed in a patient who has been fused across the L4-L5 and the L5-S1 vertebral interspaces using transpedicular screws. Treatment of lumbar spinal stenosis may include decompression laminectomies, followed by the placement of transpedicular screws (yellow arrows) with a posterior stabilization bar.
-
Sagittal view of a 3-dimensional volume computed tomography image of the lumbar spine in a patient with a posterior fusion using transpedicular screws in L4 and L5. Note that an interposition graft has been placed between L4 and L5 to maintain satisfactory intervertebral distance.
-
Three-dimensional surface computed tomography image of the lumbar spine following transpedicular screw placement across the L4-L5 interspace. Note how the tips of the screws project beyond the anterior margins of the L5 vertebral body.
-
Axial computed tomography image through the pedicles of L4 demonstrates the desired position of transpedicular screws (black arrow). The screws are connected posteriorly by a bar (blue arrow) to provide posterior spinal fixation.
-
Axial computed tomography image taken through L5 in a patient in whom transpedicular screws have been placed. Note that the screws (black arrows) are too far lateral and anterior. The iliac veins lie just anterior to tips of the screws (white arrows). Both the angle of screw placement and the length of the screws must be tailored to the individual patient.
-
Spinal stenosis. Sagittal multiplanar reconstruction (MPR) image from a computed tomography scan of the lumbar spine following posterior decompression and fusion of the L4-L5 interspace. The interposition graft (white arrow) is posterior to the desired position. The patient remained asymptomatic. Follow-up imaging should focus upon the stability of the posterior fusion, the position of the pedicle screws, and the position of the interposition graft.
-
Sagittal reformatted image from a computed tomography of the cervical spine following anterior spinal decompression and fusion. Surgical treatment of spinal canal stenosis often involves anterior vertebrectomy and bone graft interposition. The goal in such cases is to restore cervical spinal alignment (white line) while securing anterior stability. In this patient, the bone graft (double black arrows) has migrated forward (double yellow arrows). Other post operative complications may occur such as an intraspinal hemorrhage.
-
Sagittal lumbar CT performed several weeks following L5-S1 surgery demonstrates end plate changes at the L5-S1 level consistent with vertebral end plate osteomyelitis. The infection distends the anterior (white arrow) and posterior (black arrow) margins of disc interspace resulting spinal canal compression.
